Synchronization of Video with Seismic and Acoustic Data using GPS Time Signals
David P. Anderson, Brian W. Stump
Department of Geological Sciences
Southern Methodist University
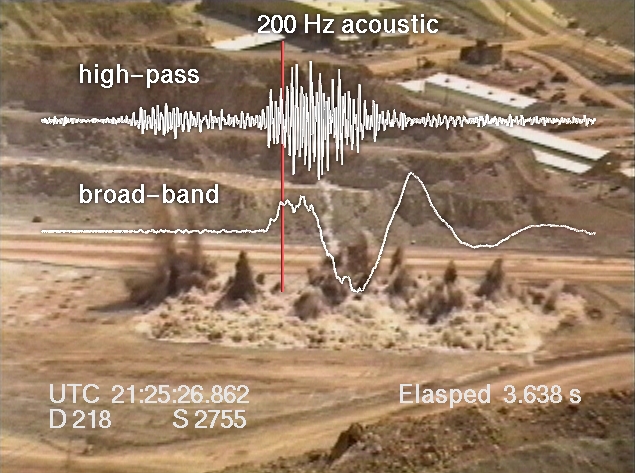
Figure 1. High-pass and broadband
acoustic signals overlay a video image of an industrial mining blast.
I. Motivation
Close-in seismic and acoustic monitoring of large industrial mining explosions provide detailed data sets that are central to understanding the source mechanisms by which these events couple seismic energy into the ground. This understanding in turn constrains the interpretation of signals observed at regional distances. A common component of many of the sources is that they are at the earth's surface and thus can be documented by camera or video. These visual observations of the blasts provide important constraints that can be applied to the physical interpretation of the seismic source function. In particular, high speed images can provide information on detonation times of individual charges, the timing and amount of mass movement during the blasting process and evidence of wave propagation away from the source. All of these characteristics can be valuable in interpreting the equivalent seismic source function for a set of mine explosions and quantifying the relative importance of the different processes, thus leading to the establishment of techniques for identifying these source types from seismic waves that have propagated to regional distances (Pearson et al, 1996).
A typical installation consists of several seismic instruments deployed at distances of a few hundred meters to a few kilometers from the blast site, in conjunction with acoustic gauges and two or three video cameras similarly arranged around the site. The data collected by the seismic and acoustic instruments are time synchronized with microsecond accuracy using Global Positioning System (GPS) receivers co-located with the data collection devices.
Figure 1 shows a single frame of video with an overlay of hi-pass filtered and broadband near-source acoustic signals for a typical industrial bulking explosion used to fragment coal before extraction. Correlation of the video with the other data sets has heretofore been accomplished manually using one of two methods. The first method depends on the blaster's use of up-hole shot tubing that cause a bright and extremely brief flash of light at the time of detonation. Using a de-interlaced video frame rate of 60 fps, each video frame has an effective sample rate of 16.667 milliseconds (Stump et al, 1996). This sample rate is generally sufficient to constrain these up-hole flashes to a single frame, and thus provide a starting point for synchronization. For blast configurations that do not use these visible indicators, analysts must search through the video records frame by frame and attempt to determine the "frame of first motion" as the starting point for synchronization.
Both of these techniques are less than satisfactory methods of synchronization of the video imagery for several reasons. These include the lack of precision of the timing itself in relation to the seismic source, the subjective nature of "first motion" observations, the inability to correct for speed-of-light vs. speed-of-seismic propagation, and the granularity of the video frame/field rate. This paper describes a method for synchronizing the video imagery with the other data sets using GPS timing signals and the Society of Motion Picture and Television Engineers (SMPTE) time code recorded directly on the video.
II. Methodology
A. Genlock
Video frame rates are nominally described as 30 frames per second (fps). Each frame is composed of two fields consisting of odd and even scan lines that are acquired sequentially, so the field rate is nominally described as 60 fields per second (fldps). In fact the actual frame rates are slightly different for historical reasons having to do with broadcast quality constraints brought about with the advent of color television. The actual frame rate is approximately 29.970000... with some very small least-significant digits residual. The first step in synchronizing the video is to lock this frame rate to exactly 29.97 frames per second, such that the video frames begin at exact boundaries of a second every 2997 frames. This in turn requires a video camera that is equipped with Generator Locking (GENLOCK) capability.
Normally the video camera synchronizes its scan rates to an internally generated clock that runs at the defined field rate. Professional cameras used in multi-camera arrangements can also phase lock their internal clocks to an external signal. This is necessary for cross fading between two live sources or for overlaying text and graphics on the camera images in real time.
Figure 2 shows the field deployment of a Sony EVW-300 video camera that comes
with GENLOCK as a standard feature. Most professional cameras provide
this feature, but it is rare in semi-professional and so-called
"prosumer" mid-priced equipment. The Sony EVW-300 is an exception as a moderately priced camera with
GENLOCK and a number of other professional features.
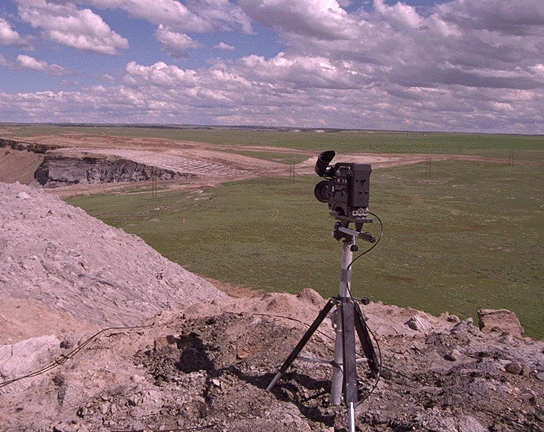
Figure 2. A Sony EVW-300
video camera with GenLock capability on a tripod is set to record a large
mining explosion.
B. Blackburst Generator
Video cameras achieve GENLOCK through the use of a broadcast quality "blackburst" generator. This is essentially a blank video frame generated with exact timing properties. For our purposes this blackburst signal must be phased-locked to a GPS timing signal. Our field kit includes an 8-channel Trimble GPS receiver and a Horita GPS synchronized blackburst generator. Figure 3 shows the entire kit packaged in a rugged watertight field box. Figure 4 provides a close-up view of the GPS receiver and Figure 5 shows the Horita Master Sync Generator. This unit provides signals to be used for GENLOCK of the video cameras.
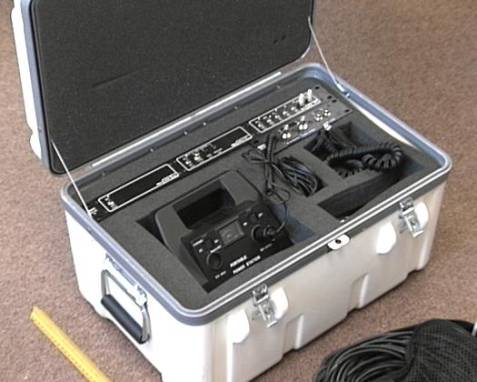
Figure 3. The field kit for GPS video synchronization.
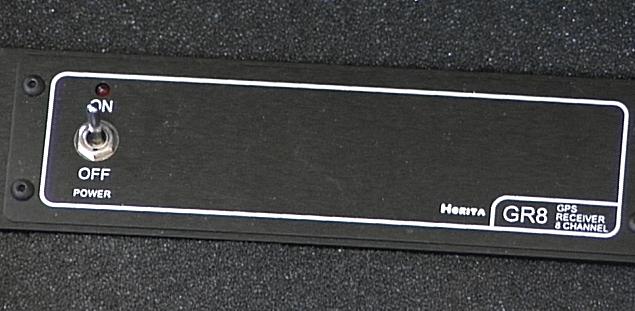
Figure 4. Horita portable packaging of the Trimble 8 channel GPS receiver.
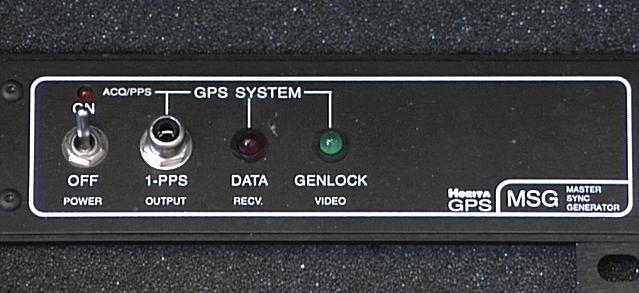
Figure 5. Horita GPS based Master Sync Generator
provides the video signal that is GENLOCK'd to the GPS.
C. SMPTE Time Code
The SMPTE time code is based on a format originally developed by NASA for telemetry in the early days of the space program. It is now widely used in film, television, and recording studios as a method for time stamping and synchronizing multiple feeds. The time code is used to modulate an audio tone that can be recorded on a standard audio channel of the video recorders. This form of SMPTE is termed Longitudinal Time Code (LTC) to differentiate it from timing information embedded in the video frame itself.
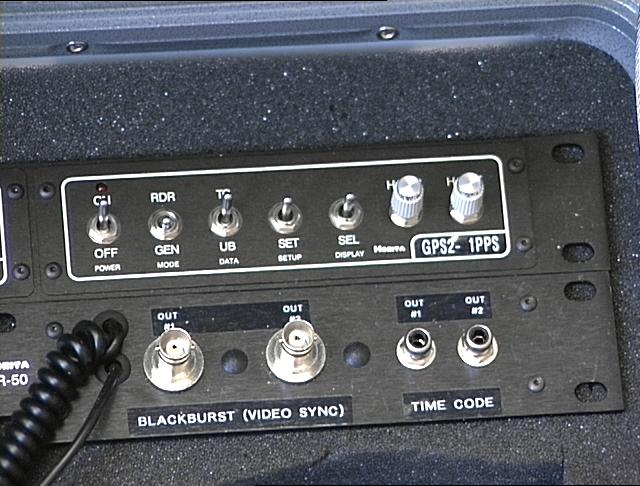
The field kit includes a Horita GPS2 LTC generator which supplies a modulated time code signal that is synchronized to a one pulse per second GPS signal. The signal definition also includes some "user bits" which may be used to encode the GPS position information (latitude/longitude/elevation), providing a complete record of time and location. Our system does not currently implement this function.
Figure 6 shows a close-up view of the one pulse per second
time code generator. Below the GPS2 are connectors for the system
power (coiled cable), GPS antenna (thin cable), two BNC connectors for
GENLOCK signals for two cameras, and two audio connectors for LTC audio
time code signals for two cameras. The Sony EVW-300 cameras can record four audio channels:
two standard Audio Frequency Modulated stereo channels (AFM) and two
16-bit digital Pulse Code Modulated (PCM) channels. This allows us
to record the SMPTE signal on one of the AFM channels and also allows recording
of stereo audio of the blast on the PCM channels, using the camera's built-in
stereo microphone.
III. Field Configuration
Figure 7 is a schematic of the interconnection of the various pieces of equipment used in the field to provide GENLOCK and SMPTE LTC signals for the video recordings. This arrangement gives microsecond accuracy for the beginning of each video field. Our standard practice has been to adjust the camera to allow for a shutter speed of 1/2000 second, the minimum exposure time available on the Sony EVW-300 cameras. This provides the sharpest images and minimizes the "smear" associated with rapidly moving objects in the field of view.
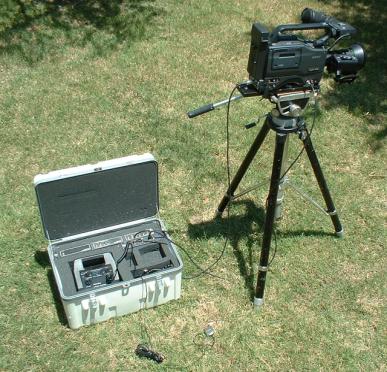
Figure 8 shows the field box and camera. The GPS
antenna is in the foreground and the GENLOCK and SMPTE cables are
attached. The normal deployment is to use two cameras spaced about 30
meters apart and placed symmetrically to view the blast. With both
cameras GENLOCK'd to the same GPS-based signal, this allows not only
correlation with the seismic and acoustic data sets but also with each other
for stereo imaging and 3-D analysis.
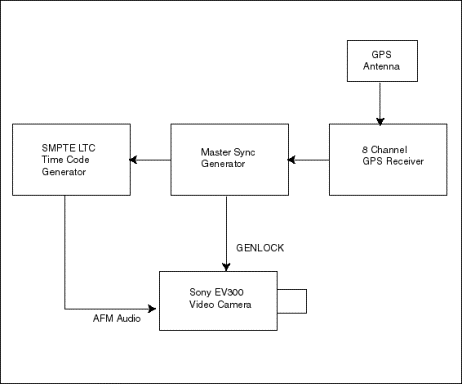
Figure 7. GPS field equipment interconnections.
IV. Laboratory Configuration
A. Direct LTC Time Code overlay
Several different methods are used to recover the GPS time stamp information from the videotape and correlate it with specific individual frames. The simplest technique is to use a time-code window generator to overlay the time stamp on the video image. This method relies on the LTC audio signal and will therefore only work when the video tape is being played. Pausing the tape to examine still images or for frame grabbing will not display the time stamps. To view time stamps associated with individual frames requires converting the SMPTE signals from Longitudinal Time Code to Vertical Interlace Time Code (VITC) signals.
Figure
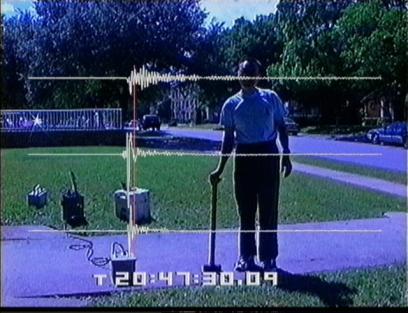
9. Video Frame with SMPTE time stamp window overlay.
Figure 9 shows a single field of video that has been de-interlaced and time-stamped with the VITC signal along with the horizontal and vertical seismic waveforms generated by the sledge hammer of SMU researcher Rong-Mao Zhou. The vertical red cursor marks the point in the waveform that corresponds to this video image. The time stamp indicates that this frame was recorded at 20 hours, 47 minutes, 30 seconds, and this is field 0 of the 9th frame of this second. Field 1 of the 9th frame will be indicated with a colon (:) rather than a period (.) separator for the last two digits. Each field represents 16.667 milliseconds of elapsed time.
Additional information regarding the generation and
compositing of seismic and acoustic waveforms is available from www.geology.smu.edu
B. Converting Longitudinal Time Code to Vertical Interlace Time Code
Standard video streams are scanned from the top of the screen to the bottom sequentially. The video signal incorporates a blanking interval that turns off the image while the scan returns to the top of the screen. Current broadcast usage is to exploit this vertical blanking interval to write digital data such as closed captioning information directly into the video frame. Vertical Interlace Time Code signals may also be written directly into the video data stream during this vertical retrace. Because the VITC signal is part of the video frame, it can be read while the videotape is paused, and it accompanies the images when they are copied or frame-grabbed. Figure 10 shows an LTC to VITC converter than may be used to generate these signals from the audio SMPTE signals recorded on the videotape. The resulting time stamps indicate hours, minutes, seconds, frames, (30 per second) and fields (2 per frame).
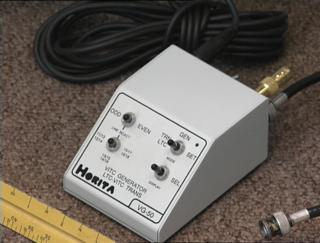
Figure 10. Horita VG-50 LTC to VITC conversion
C. Time stamp window overlay
Figure 11 displays the Horita VWG-50 VITC window generator. This device reads a VITC encoded video signal and outputs a video signal which is a composite of the original image and a time stamp window. Switches on the box allow the user to choose between two different size fonts and placement of the overlay window at the top or bottom of the video image. This device also provides an RS-232 serial output containing the time stamp information for each frame as ASCII text.
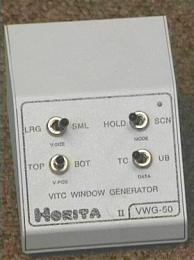
Figure 11. Horita VWG-50 VITC Window Generator
Using the LTC to VITC converter to time stamp each
individual video field while the video is digitized or recorded on
high-resolution medium like laser disk allows the timing information to
be stored with the images without actually being displayed.
The images are subsequently frame-grabbed and stored as individual
pictures. During that process the times-stamps are acquire for each field
using the RS-232 serial ASCII feature of the VITC window generator, and used in
the naming convention for the individual image files.
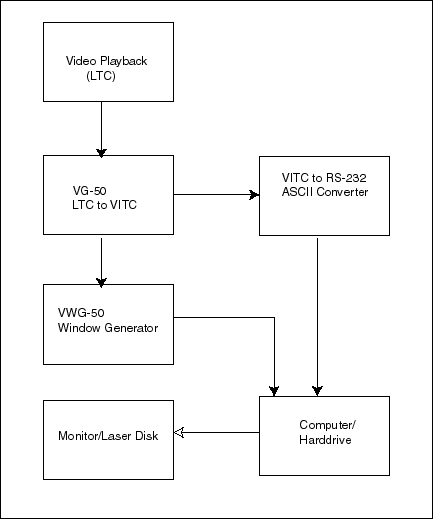
Figure 12. Laboratory
equipment interconnection for video post processing.
V. Using the SMPTE Time Code.
A. Time Stamp Format
Figure 1 is a frame of video from which the LTC signals were converted to VITC and then used in the naming convention of the individual files. Subsequent image processing separated the frames into fields (Stump et al, 1996) and generated the waveforms and labels that were then composited onto the video images. The title indicates that these waveforms are derived from acoustic gauges acquired with a 200 Hz sample rate. The upper and lower traces are high-pass filter and broadband extractions of that data. The vertical red cursor bar indicates the point-in-time along the waveforms for this particular video image.
The GPS time stamp information is displayed in two different formats. In the lower left corner these data have been reformatted from the hour:minute:second:frame:field format of the SMPTE time code to Universal Time Coordinates (UTC) and displayed in hours:minutes:seconds:milliseconds format (21:25:26.862). Below that field the day of the year is displayed in Julian format (D218) followed by the mine's code for this particular blast (South 2755).
The code in the lower right corner of the image displays the elapsed time in seconds and milliseconds (3.638) since the initiation of the blast. This figure is computed using the seismic records to determine the actual start time of the blast and subtracting the seismic travel times from the center of the shot pattern to the camera location.
B. Waveform and Video Correlation
The addition of GPS-based SMPTE time codes to the video records provides that all of the data sets collected -- seismic, acoustic, and video -- can be time-aligned with great accuracy. The question of how to present these data is not necessarily obvious, however, because the travel times for the three differ substantially. That is: speed-of-light for video (200,792,458 meters per second) speed-of-sound for acoustic( 340 meters per second at sea level) , and speed-of-seismic propagation (3000 meters per second, dependent on local geology). GPS time alignment for all three sets as viewed from the camera location would show the visual event first, followed by the seismic signal, and then the acoustic signal.
For purposes of analysis of the source mechanisms of the blast it is more useful to subtract off the travel times for the acoustic and seismic signals and align these waveform data with the video as if all occurred simultaneously at the camera location. This has become our standard practice. The full animation of the blast from figure 1 illustrates this technique for acoustic waveforms. A large cast-blast documented in 1995 integrates the acoustic and seismic waveforms with video and computer timing models. These and other similar blasts can be downloaded separately from www.geology.smu.edu.
Video and
Acoustic
Video,
Seismic and shot model, bulking shot
Video,
Seismic, and shot model, cast blast
Video,
Acoustic, Seismic and shot model
VI. Conclusions
The widespread use of various forms of data logging has made apparent the need for some common method of correlating the various data sets. The Global Position Satellite network and the advent of inexpensive GPS receivers provide a set of timing signals with the necessary accuracy and availability to satisfy this requirement. Hybrid equipment like that available in the broadcast industry which has the capability for synchronizing GPS timing signals with existing industry timing standards like GENLOCK and the SMPTE time codes can be exploited for this purpose.
Further advances in the state of the art are likely to make these standards more ubiquitous. For example, several manufacturers have announced intentions to produce consumer-level equipment such as cell-phones and digital cameras with built-in GPS receivers. At least one GPS manufacturer, Garmin, has already marketed GPS receivers with built-in radios that can communicate time and location information to other devices over several kilometers using public-domain radio channels.
Video cameras with built-in GPS receivers providing GENLOCK will allow multiple-camera setups to be run independently without lengthy, expensive, and cumbersome cabling and signal relay amplifiers. This in turn will allow collection of multiple points of view that can be used for 3-D analysis as well as provide data redundancy.
For the analysis of mining explosions, this technology allows researchers to collect detailed 3-D data which can be accurately aligned with seismic and acoustic signals using relatively inexpensive recording and coordinating equipment.
VII. References
Stump, B.W., D.P. Anderson and D.C. Pearson, 1996. Physical Constraints on Mining Explosions, Synergy of Seismic and Video Data with Three Dimensional Models, Seismol. Res. Lett., 67, 9-24.