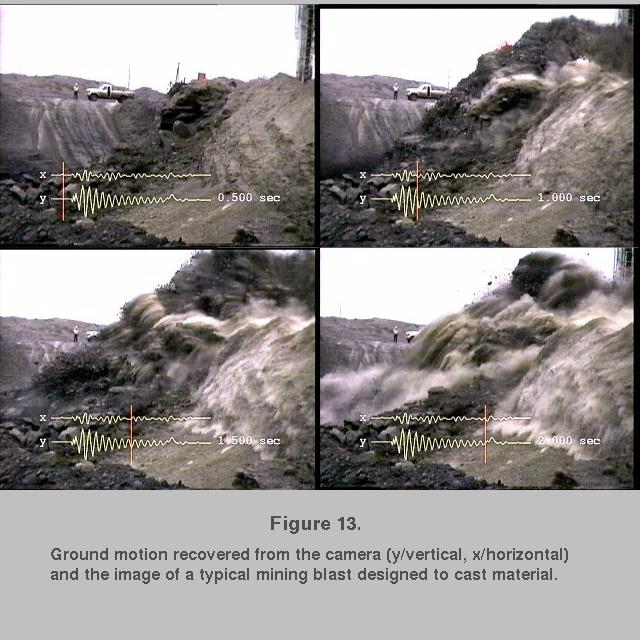
 Figure 13.
Ground motion recovered from the camera (y/vertical, x/horizontal)
and the image of a typical mining blast designed to cast material
Figure 13.
Ground motion recovered from the camera (y/vertical, x/horizontal)
and the image of a typical mining blast designed to cast material
V. INTERPRETATION
Single Shot Analysis
A single explosive source, animated earlier (Figure 8), was detonated in an experimental study designed to investigate the differences between spherical and cylindrical sources and quantify the effect of the free face in front of the explosion on the radiated waveforms (Stump et al., 1994; Yang and Stump, 1995). The first experimental data set is from the detonation of a single cylindrical explosion using emulsion with a total weight of 653 lb. The burden was 18-22 ft and the depth of the borehole was 27 ft.
Figure 13.
Ground motion recovered from the camera (y/vertical, x/horizontal)
and the image of a typical mining blast designed to cast material
Four frames from the
explosion separated by 500 msec are displayed in Figure 13. The camera
motion is given in the bottom center of each frame while the time of the image
is
represented by the vertical bar. These images along with those in the video
emphasize the strong contribution of the direct shock from the explosion to the
radiated wavefield. The actual ground motion recorded near the camera
(Figure 8) and the camera motion (Figure 13) are completed before any of the
material cast into the mine impacts the mine floor (despite the fact that the
camera tripod acts as an under damped pendulum).

Multiple Shot Analysis
The interpretation of source processes and the generated ground motion is further illustrated by combining the model of the 4x4 array of cylindrical charges developed earlier (Figure 6) with observations from the test. Source measurements in this experiment included high speed film, velocity of detonation, Hi-8 video, ground acceleration and velocity. The velocity of detonation of the explosive in each of the sixteen holes documents the exact detonation time of each borehole (as opposed to the design delay time) and thus provides the time information critical to the combining of the different data sets. One frame of the integrated visualization of the source processes using all the data is reproduced in Figure 14. The model of the blasting process is displayed in the upper left hand corner of the image . The velocity of detonation data from each individual borehole is used to determine the time at which each borehole detonates and then generates a compressional wave represented by the expanding red circle in the model. In this example (unlike the Russian blast in Figure 12), no two boreholes detonate at the same time thus producing a more complex pattern of seismic energy. Comparison of this model with that for the Russian explosion illustrates in pictorial format how important (and different) blasting practices at various mines may be in the source identification process.
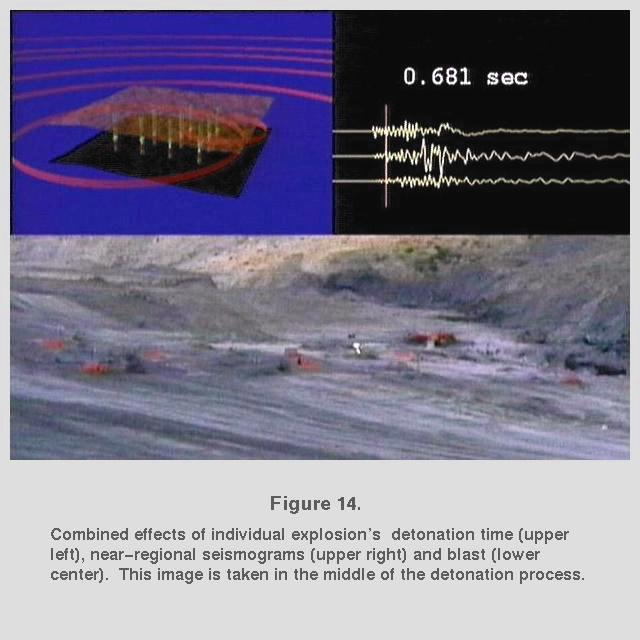 Figure 14.
Combined effects of individual explosions detonation time (upper
left), near-regional seismograms (upper right) and blast (lower center). This
image is taken in the middle of the detonation process.
Figure 14.
Combined effects of individual explosions detonation time (upper
left), near-regional seismograms (upper right) and blast (lower center). This
image is taken in the middle of the detonation process.
In the upper right hand corner of Figure 14 are the vertical, radial and transverse ground velocities recovered from an instrument close to the video camera. The red vertical line in this image represents the time point of the model and the video, thus providing the link between the data and the models. The P waves generated by the directly coupled shock energy of the first few explosions in the array have already arrived at the seismometer. The video of the explosion is displayed in the bottom half of the figure and also documents the fact that at this point in time the total explosive array is only partially detonated. In the center right portion of the video image, two white flashes are observable. These are Nonel detonating cord which are connected to explosive boosters downhole in each hole. The flash of this cord is concurrent with the detonation of a particular borehole. Careful inspection of the first two rows of explosives in the figure identifies a reflectance change in the near-by soils as the cylindrical stress wave from each explosion propagates away. This effect can be more easily seen when the individual frames of the visualization reproduced in Figure 14 are animated.
![[movie icon]](jpeg/multan3_small.jpg) MPEG Movie 7. (192x144, 1M)
Multi-shot model combined with video and ground motion.
MPEG Movie 7. (192x144, 1M)
Multi-shot model combined with video and ground motion.
MPEG Movie 7. (320x240, 2.3M)
Figure 14 and the companion animation begin to provide a glimpse of the
interpretative tools provided by combining ground motions with video and
models of the blasting process.
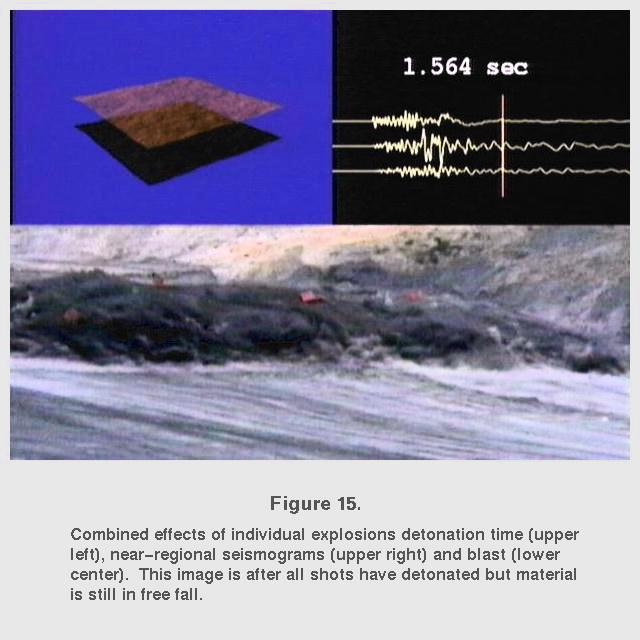 Figure 15.
Combined effects of individual explosions detonation time (upper
left), near-regional seismograms (upper right) and blast (lower center). This
image is after all shots have detonated but material is still in free fall.
Figure 15.
Combined effects of individual explosions detonation time (upper
left), near-regional seismograms (upper right) and blast (lower center). This
image is after all shots have detonated but material is still in free fall.
One constraint on the contributions of source processes to the radiated wavefield can be made by comparison of the seismograms and the video after all the explosions in the multiple shot experiment have detonated (Figure 15). The impulse of the individual explosions can be seen in the P waves while the latter, longer period surface waves are complete before the cast or spalled material re-impacts. In Figure 15, one can see that the material around the explosions is still lofted or spalled to a relatively large height and, as the vertical red bar indicates in the seismogram, the significant ground motion is complete.
These images and those from the single explosion (Figure 13) argue that the spalled or cast material has little contribution to the time domain representation of the near-source waveforms within the 2 Hz bandpass of the seismometer.
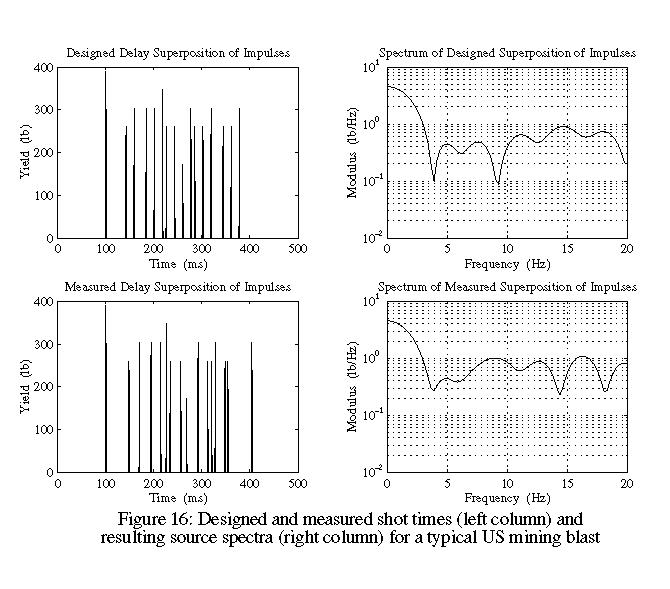 Figure 16.
Design and measured shot times (left column) and resulting source
spectra (right column) for a typical US mining blast
Figure 16.
Design and measured shot times (left column) and resulting source
spectra (right column) for a typical US mining blast
Because of 500 ms downhole delays in each hole of this explosive array, and the variances associated with these detonators, large differences between the designed and observed detonation times for each borehole were documented with the velocity of detonation measurements (Figure 16). The designed detonation pattern produces the distinctive spectral scalloping that could be used as a discriminant for this type of explosion. As the spectrum for the design shot pattern indicates, holes at 4 and 8 Hz could be used for identification. The measured detonation times obscure this pattern to some extent as indicated in the second spectrum displayed in Figure 16. Although there is significant variation in the spectral amplitudes as a function of frequency introduced by the actual detonation times of the individual explosions, the sharp spectral holes are eliminated.
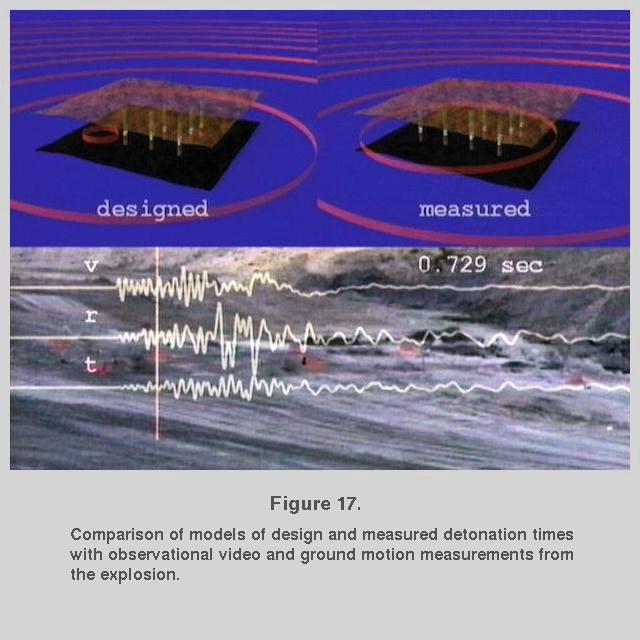 Figure 17.
Comparison of models of design and measured detonation times
with observational video and ground motion measurements from
the explosion.
Figure 17.
Comparison of models of design and measured detonation times
with observational video and ground motion measurements from
the explosion.
Differences between the designed and measured detonation times in the explosive array can be further illustrated by combining models of the explosive process for each with the observed video and ground motions. One frame from this visualization is replicated in Figure 17. Comparison of the generated compressive wave (red rings) from each model provides a measure of the departure of the measured from the designed blasting process.
Correlation with the ground motion and video data provides model validation. Again, only one frame of the visualization is reproduced and complete correlation is improved by observing the time varying aspects of the problem through the movies.
MPEG Movie 8. (2.5M) A 1000 frame-per-second movie of Figure 17.
Go to
Table of Contents
or
Next Section