
III. DATA RECORDING AND PROCESSING
Ground Motion Data
Velocity and acceleration waveforms were acquired with a 16-bit Refraction Technology Data Acquisition System, Terra Technology accelerometers and Sprengnether S-6000 2 Hz seismometers. As noted in Figures 1 and 2, the seismometers were used in the quantification of the near-regional (several to tens of kilometers) wavefield while the accelerometers were deployed very close to the blasts (tens to hundreds of meters) providing good azimuthal as well as range coverage of the test bed. Typically the data were sampled at 250 or 500 samples per second in order to characterize the waveforms in as broad a frequency band as possible. Accelerometer data were integrated to velocity for interpretation purposes. First arrival time data from the explosions were used in conjunction with the P and S refraction data (Figure 3) to build a velocity model for the test site. This model was refined through waveform modeling. Typically at the ranges where observations are made, it is important to model both the body and surface waves as it is the combination of these arrivals that provide the best constraints on the near-surface P and S velocity structure.
Video Data
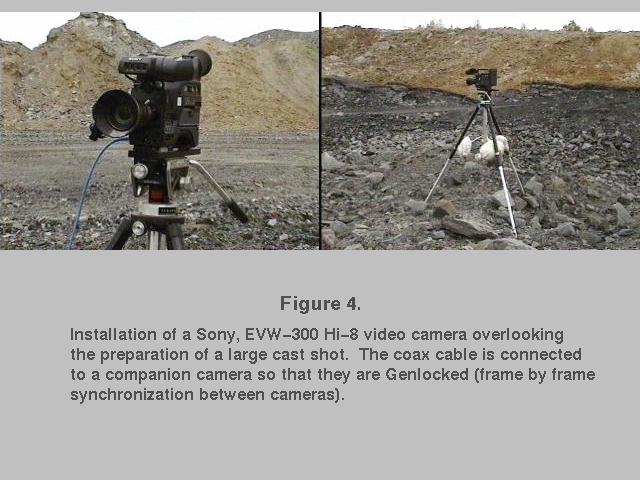 Figure 4.
Installation of a Sony, EVW-300 Hi-8 video camera overlooking
the preparation of a large cast shot. The coax cable is connected to a
companion camera so that they are Genlocked (frame by frame
synchronization between cameras).
Figure 4.
Installation of a Sony, EVW-300 Hi-8 video camera overlooking
the preparation of a large cast shot. The coax cable is connected to a
companion camera so that they are Genlocked (frame by frame
synchronization between cameras).
The blasts were recorded on Hi-8 video cameras at 30 frames/s and shutter speeds as high as 1/10000 s. These cameras were chosen over standard VHS because of their improved resolution while retaining relatively low cost. In order to produce multiple images of the same blasts that can be correlated, cameras were chosen for some of the experiments that had Genlock capability [locking to an externally generated synchronization signal such that the scan rates of the two cameras represent identical temporal events]. An example of a camera deployment in a mining operation is given in Figure 4. Cameras are placed as close as 100 m from a single cylindrical charge, parallel with the free face in front of the charge. Larger milli-second delay fired explosions necessitate separations between the explosions and the camera as great as a kilometer. It has been found useful to deploy cameras both in front (above the free surface if possible) and in back of the bench on which multiple hole explosions are detonated as well as in the pit where material will be cast.
These different views of the blast provide the data to quantify the performance of the individual explosions in the array as well as constraining the timing of secondary source phenomena such as material cast into the pit. Often there are ground motion sensors installed either near-by or directly on the camera tripod for correlation with the video.
Key to combination and analysis of the different data sets is utilization of digital representations of each. The seismic and acoustic data as well as topographic information is typically gathered in digital form. It was necessary to assemble the necessary hardware and software tools for digitizing the video images. Raw video images are transferred frame by frame to a Sony CVR 5000 laser disk using the Silicon Graphics Inc. SGI Indigo 2 workstation with a Galileo video card to compensate for data rate errors inherent in the analog video media and to assure that no data frames are duplicated or dropped. The laser disk is a write once media and stores 43,500 video frames on each side of the removable media making it cost effective for high resolution component video data archival (~$300 per disk). Once the data is stored on laserdisk, it is digitized from the laser disk and transferred to hard disk using the SGI Galileo Video card. This process produces digital RGB format color images, each 640x486 pixels with each pixel represented by 24 bits of color information. The standard frame rate is 30 frames/s thus representing a data rate of approximately 30 Megabytes/s for the digital video. With typical blasts lasting between 5 to 20 seconds, a single video data volume of the explosion is between 150 and 600 MBytes. It is important to have large disks and large computer memory for effective processing of these data sets. Compression algorithms such as JPEG or MPEG can be used to reduce the size of these files with minimum loss of resolution although fast hardware implementations of these compression schemes are best for rapid data review.
The digital video files are converted from RGB format to compressed Run Length Encoded (RLE) format using the Utah Raster Toolkit conversion utility (URT tools are available free from the ftp anonymous login cs.utah.edu). This package of programs provides numerous processing tools for the digital video images.
Single Shot
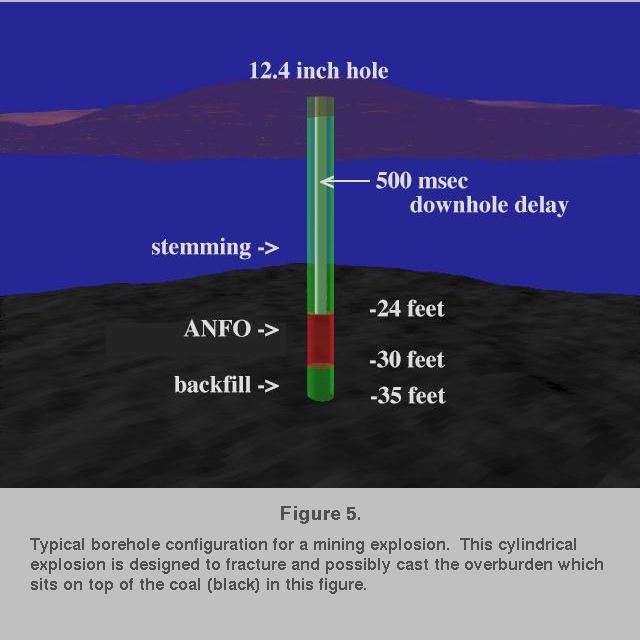 Figure 5.
Typical borehole configuration for a mining explosion. This
cylindrical explosion is designed to fracture and possibly cast the overburden
which sits on top of the coal (black) in this figure.
Figure 5.
Typical borehole configuration for a mining explosion. This
cylindrical explosion is designed to fracture and possibly cast the overburden
which sits on top of the coal (black) in this figure.
One of the experimental sources documented in this paper is a single
cylindrical borehole detonated next to the free face of the mine. As Figure 5
illustrates, the borehole is loaded with explosive (ANFO, emulsion or mixture) and then
backfilled to minimize airblast. Although not shown in this figure, the charge
is
typically spaced 20-30 feet from the free face of the mine. Detonation of the
explosion will then fail the material between the free face and the borehole.
The resulting momentum imparted to the rock will move the material into the pit.
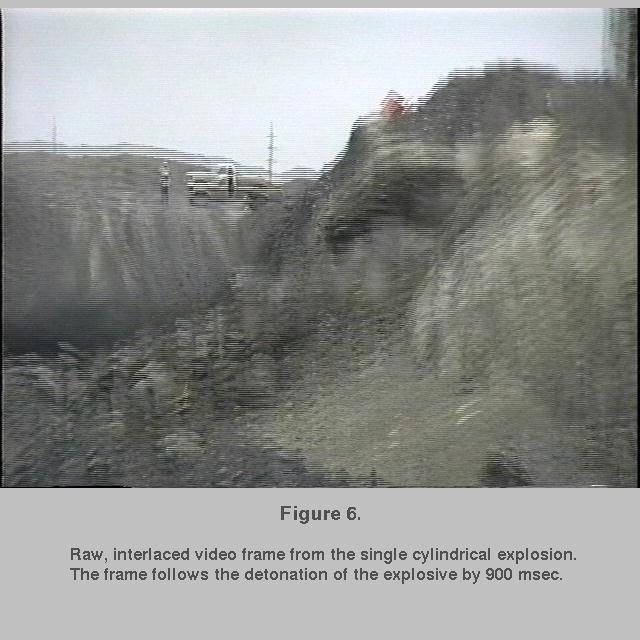 Figure 6.
Raw, interlaced video frame from the single cylindrical explosion.
The frame follows the detonation of the explosive by 900ms.
Figure 6.
Raw, interlaced video frame from the single cylindrical explosion.
The frame follows the detonation of the explosive by 900ms.
Video images of this casting process are captured. Although the video frame
rate is 30 frames/s at 640x486 pixels, the video cameras actually capture 60
fields/s at 640x243 pixels and then interlaces two fields 1/60s apart to
produce the full 640x486 frame [This is done in standard NTSC video formats to
reduce frame flicker without resorting to long-persistence phosphors in the TV
CRT]. Figure 6 illustrates one of the interlaced frames from the single,
cylindrical explosion. The camera in this case is oriented parallel to the
strike of the free face of the mine.
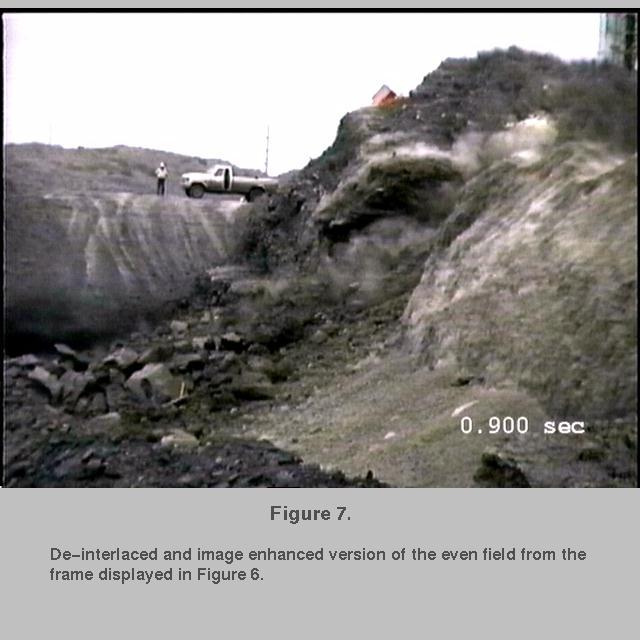 Figure 7.
De-interlaced and image enhanced version of the even field
from the frame displayed in Figure 6.
Figure 7.
De-interlaced and image enhanced version of the even field
from the frame displayed in Figure 6.
The fuzzy character of
the image is due to the rapid speed at which the material is moving and the
interlacing of two fields sampled 1/60s apart to produce a single video frame
(640x243 each). The frames are de-interlaced into one even and one odd field
and each linearly interpolated into its own frame (640x486) which represent two
time points separated by 0.01667s. Additional contrast and image
enhancement is performed on the de-interlaced images using RLE public
domain utilities. The marked improvement in the image quality after these steps
is illustrated in Figure 7.
![[movie icon]](jpeg/sshot0_small.jpg) MPEG Movie 1. (192x144, 256k)
Single Shot Video, de-interlaced and image enhanced.
MPEG Movie 1. (320x240, 660k)
MPEG Movie 1. (192x144, 256k)
Single Shot Video, de-interlaced and image enhanced.
MPEG Movie 1. (320x240, 660k)
Although not obvious in the single frames and fields displayed in this paper, the camera moves as the P wave arrives at the recording site. This motion degrades the interpretation of the blast and so a simple correction scheme called de-jittering was devised. The location of a stationary distant point or points is noted in each frame and the field is corrected to this location to remove camera motion. The resulting corrections for the frames in the video are combined to produce a representation of the camera motion in the plane of the image. The individual frames are then combined and animated on the SGI to produce a digital record of the blast at 0.01667s resolution. These images can now be used to determine the timing of source related processes as well as a quantification of size and volume of material affected by the explosion.
![[movie icon]](jpeg/sshot2_small.jpg) MPEG Movie 2. (192x144, 348k)
Single Shot Video with camera shake removed.
MPEG Movie 2. (192x144, 348k)
Single Shot Video with camera shake removed.
MPEG Movie 2 (320x240, 660k)
The final step of the process is to combine the digital video images with the digital ground motions so that one can investigate the relationships between the ground motion and the source processes as recorded by the camera. The ground motions are superimposed on the bottom of the video frame along with a vertical cursor that indicates the location in time of the waveform relative to the image currently being viewed. Time correlation between the video images and the ground motion records is made taking into account the P travel time to the receiver. The composite images are reconverted to RGB format and sequenced one frame at a time back onto the laser disk. The laser disk can then be used to play the animation at speeds from 30 frames per second (1/2 real time after de- interlacing) to a single frame stop motion. The ability to interact with the animation at various speeds has proven to be one of most important visualization tools. One composite frame is given in Figure 8.
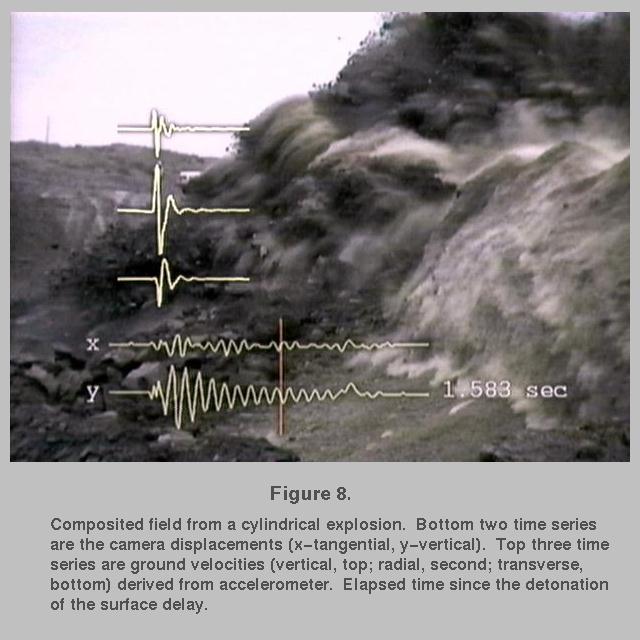 Figure 8.
Composited field from a cylindrical explosion. Bottom two time
series
are the camera displacements (x-tangential, y-vertical). Top three time series
are ground velocities (vertical, top; radial, second; transverse, bottom)
derived
from accelerometer. Elapsed time since the detonation of the surface delay.
Figure 8.
Composited field from a cylindrical explosion. Bottom two time
series
are the camera displacements (x-tangential, y-vertical). Top three time series
are ground velocities (vertical, top; radial, second; transverse, bottom)
derived
from accelerometer. Elapsed time since the detonation of the surface delay.
Comparison of the ground motion record with the camera displacements illustrates the under damped pendulum response of the camera tripod. The near-source ground motions are completed many ms prior to the video image displayed in Figure 8. The image also illustrates that there are still many dynamic processes taking place in the source region despite the small ground motions. Careful review of the animation reveals the importance of the initial shock from the explosive in generating the near-source ground motions. The P wave as it propagates from the initial shock to the camera can be seen as a reflectance change in the near-surface materials. These two observations indicate that, for the recorded near-source ground motions, late time explosion phenomena, including the material cast out into the pit, do not contribute to these waveforms.
Multiple Shot
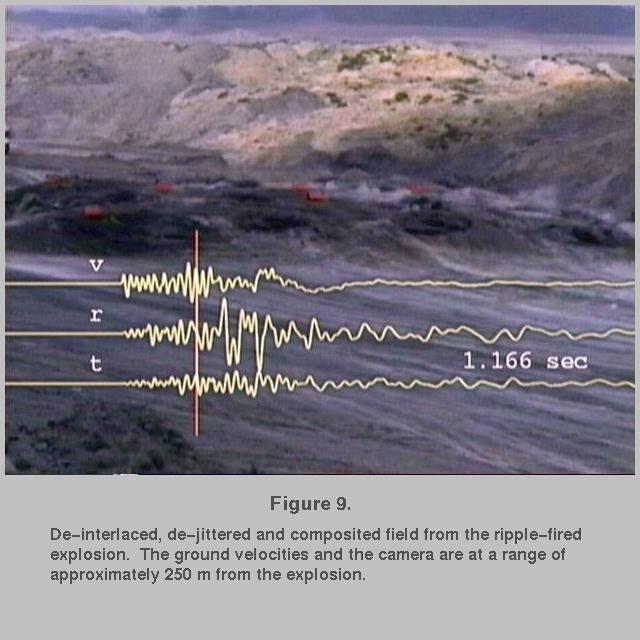 Figure 9.
De-interlaced, de-jittered and composited field from the ripple-fired
explosion. The ground velocities and the camera are at a range of
approximately 250 m from the explosion.
Figure 9.
De-interlaced, de-jittered and composited field from the ripple-fired
explosion. The ground velocities and the camera are at a range of
approximately 250 m from the explosion.
These processing and visualization tools can be further illustrated with a second example. Four rows each with four cylindrical explosive boreholes were sequentially detonated. The explosive boreholes along with their sequential detonation, were designed to bulk the material in the source region to aid in its removal. The processing scheme described above was applied to the data set including combining video images with ground motions observed near the camera location. The non-electric detonating system is identifiable as it operates (flashing of Nonel cord on ground surface). Further, the detonation of the individual charges, the interaction of the motion between the individual charges, and the spall of the material is obvious. The frame rate of the video is not fast enough to constrain the exact detonation time of all the surface delays. High speed film or video with frame rates as high as 500 frames/s are more appropriate for this task. Figure 9 illustrates one field from the delay-fired explosion.
![[movie icon]](jpeg/mult2_small.jpg) MPEG Movie 3. (192x144, 470k)
of image processed Multi-Shot Blast
MPEG Movie 3. (192x144, 470k)
of image processed Multi-Shot Blast
MPEG Movie 3 (320x240, 1.7M)
This example and the accompanying movie illustrates the strong interpretative
synergism the video images provide for the waveform data. The P waves from
each of the individual explosions are easily identified in these
representations.
Go to Table of Contents or Next Section