Physical Constraints on Mining Explosions
IV. MODELS
A critical element in the interpretation of the observational data is the
development of models that include varying degrees of assumptions
concerning important source processes. Constraint of these models by the
observational data sets then provides the mechanism for assessing
assumptions implicit in the models. The fundamental components of this
problem that are emphasized in these models and the accompanying
visualizations are the spatial and temporal aspects of the problem and the
relationship to the observations.
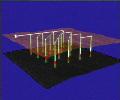 Figure 10.
Model representing the spatial and temporal characteristics of a
typical mining explosion. Uphole time delays are represented by the horizontal
burning lines between holes while downhole delays are represented by the
vertical burning lines. Explosive red and stemming green.
Figure 10.
Model representing the spatial and temporal characteristics of a
typical mining explosion. Uphole time delays are represented by the horizontal
burning lines between holes while downhole delays are represented by the
vertical burning lines. Explosive red and stemming green.
One of the critical elements of mining explosions that is different from
contained,
single fired explosions is the process of delay firing individual explosions in
an
array in order to maximize the fragmentation and throw of rock while minimizing
peak ground motions. This blasting pattern forms one fundamental difference
for mining explosions that a number of authors [Baumgardt and Ziegler, 1988;
Smith,1989; Hedlin et al., 1989] have argued will provide discriminants as well
as reduce the size of regional or teleseismic signals. A model that
characterizes these spatial and temporal effects is the first step in the
interpretation of the observational data. Using a simple ray tracing algorithm
that is common in the animation community, the 4x4 array of cylindrical
boreholes for which data were displayed earlier (Figure 9) is shown in Figure
10.
![[movie icon]](jpeg/multan_small.jpg) MPEG Movie 4. (192x144, 520k)
Multi-Shot Model.
MPEG Movie 4. (192x144, 520k)
Multi-Shot Model.
MPEG Movie 4. (320x240, 1.5M)
The explosions are imbedded in a shale layer overlying a coal seam that is
to be mined (Figure 5). The sixteen explosions in the array are designed to
detonate at a sequence of times controlled by a combination of uphole and
downhole delays. The uphole delays provide the relative timing among shots
and are short in duration (10's msec) while the longer and constant downhole
delays (100's msec) are designed in series with the uphole delays so that all
uphole delays are completed before any explosive column detonates. To
illustrate these effects, the timing in the delay pattern is represented in the
model by a series of horizontal (uphole delays) and vertical (downhole delays)
lines that 'burn' (stars in Figure 10 which move in the animation) for a time
proportional to the design delays. One can animate the blasting process with
multiple representations in time of the above model. Implicit in this
representation is information concerning the viewing location of the observer,
lighting and perspective. Comparison of these models to observational data
requires selection of these parameters consistent with the location of
observations which will be compared to the models.
![[movie icon]](jpeg/tyrnyauz_small.jpg) MPEG Movie 5. (192x144, 30k)
Tyrnyauz Moly Mine Blast in Southern Russia
MPEG Movie 5. (192x144, 30k)
Tyrnyauz Moly Mine Blast in Southern Russia
MPEG Movie 5. (320x240, 66k)
Models such as the one depicted in Figure 10, when compared to observational
data provide the mechanism for assessing the importance of these temporal
and spatial source effects on the resulting phenomenology. We use a mining
explosion documented in Southern Russia (Stump et al., 1994) to illustrate this
point. In this case, six rows of explosives are detonated with 40 ms delay
between rows. A number of individual explosions were detonated on the
surface, producing particularly strong acoustic signals. The three-dimensional
structure of the source region as well as the locations of the individual
explosions were surveyed by the mine, providing the fundamental geometrical
data for the model. In order to track the progression of the explosions in the
model, individual explosions are represented by small spheres (blue) in the
model prior to detonation and turn red and grow in size at the time of
detonation. Each individual explosion then becomes the source of cylindrically
spreading compressional (light blue) and acoustic (orange) energy with the
velocity of the expanding wavelet constrained by in situ velocity determinations
for the compressional energy and 300 m/s for the acoustic energy.
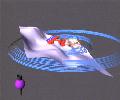 Figure 11.
Three dimensional spatial/temporal characteristics of the explosions
and mine are illustrated with the propagation of compressional(blue) and
acoustic (yellow) energy. Instrument location is designated by purple sphere.
Figure 11.
Three dimensional spatial/temporal characteristics of the explosions
and mine are illustrated with the propagation of compressional(blue) and
acoustic (yellow) energy. Instrument location is designated by purple sphere.
Figure 11 is
one time frame from the model. At the time represented by this image,
the first row of explosions on the second bench is just detonating as indicated
by the red spheres. Compressional waves from the two rows on the lower
bench have already propagated away from these explosions toward the
seismometer (purple symbol). The time delay between the individual rows in
the explosive array is expressed by the spatial separation of compressional
energy from each of the first two rows of explosions in this figure. It is the
constructive and destructive interference of the energy from each of these rows
which may provide an effective discriminant for these types of sources
(Baumgardt and Ziegler, 1988; Smith,1989; Hedlin et al., 1989).
For the
blasting technique employed in this example where a number of explosions are
simultaneously detonated, small variations in the individual detonation times
will have a minor effect on the constructive and destructive interference
between the packets of energy generated by each row. One can also see the
effects of spatial finiteness of each row on the radiated compressional waves.
The wavefronts whose normals are parallel to the line of explosives are more
dispersed than those perpendicular to the line of explosives. The lower
velocity of the acoustic waves is also apparent.
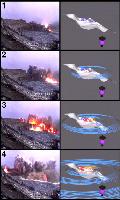 Figure 12.
Data (left column) and model (right column) from a
mining explosion in Southern Russia.
Figure 12.
Data (left column) and model (right column) from a
mining explosion in Southern Russia.
The last step in the modeling effort is comparison with observational data. As
an illustration of this process, the model for Southern Russia is combined with
video images of the explosions. This integration provides the opportunity for
improved interpretation of the actual explosion. Video images of the explosions
at the same time intervals as the models are compared in Figure 12.
The model
allows one to follow the detonation process in the video images beginning with
the first row of explosions in the top image progressing to the last row in the
bottom image. The resulting compressional and acoustic energy can be seen
in the model visualization.
The video and model comparisons indicate that the
explosions in each row detonate nearly simultaneously in this experiment.
The
video data also provides documentation of the surface explosions and the fact
that the individual boreholes are unstemmed as evidenced by the burning gas
ejected from each hole. It is this aspect of these explosions that leads to
their
strong airblast arrival. The last piece of data that must be added to these
visualizations is the measured ground motions and acoustic waves to complete
the interpretation.
MPEG Movie 6. (192x144, 395k)
Tyrnyauz Blast Model
MPEG Movie 6. (320x240, 1M)
Go to
Table of Contents
or
Next Section
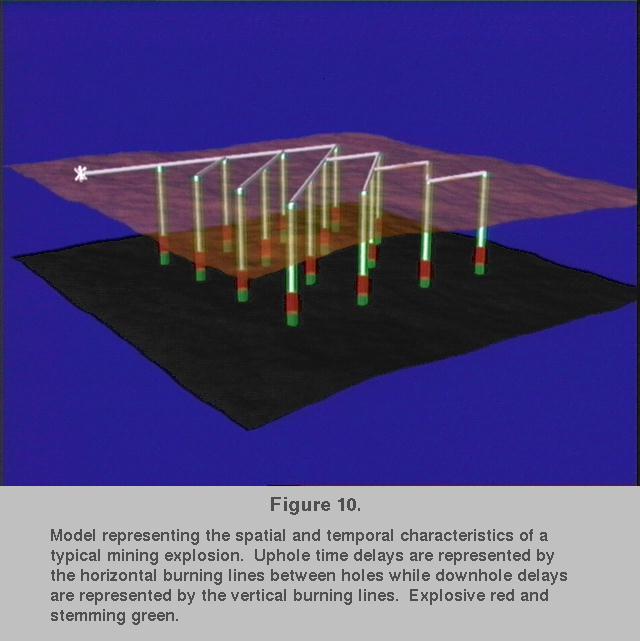 Figure 10.
Model representing the spatial and temporal characteristics of a
typical mining explosion. Uphole time delays are represented by the horizontal
burning lines between holes while downhole delays are represented by the
vertical burning lines. Explosive red and stemming green.
Figure 10.
Model representing the spatial and temporal characteristics of a
typical mining explosion. Uphole time delays are represented by the horizontal
burning lines between holes while downhole delays are represented by the
vertical burning lines. Explosive red and stemming green.
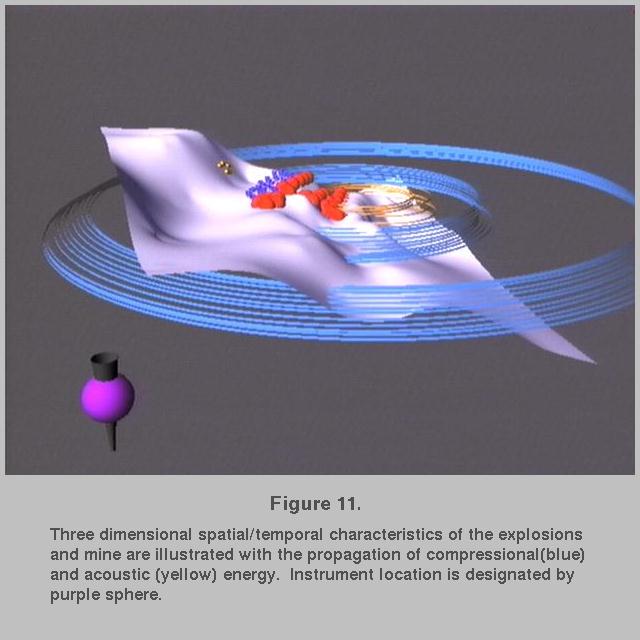 Figure 11.
 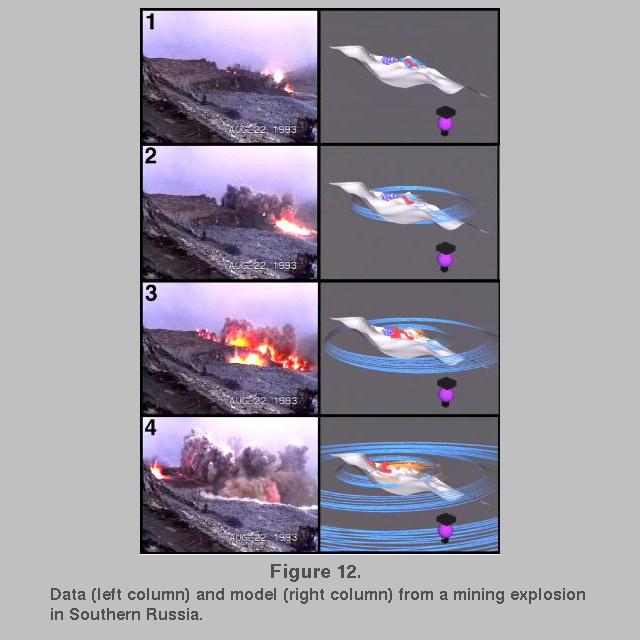 Figure 12.