Petrologic Analysis of Eastern Sultanate of Oman
by Leslie F. Bleamaster III
 The
Sultanate of Oman is host to the Earth's largest mass of exposed ancient
oceanic crust, the Samail Ophiolite. Rock types within the ophiolite
include peridiotites, gabbros, basalts, and serpentanites. The surrounding
geology is a complex collection of intensely deformed quartzites, mafic
schists (including eclogite assemblages), calc-schists, dolomites and other
carbonates. Because of Oman's dry climate, lack of vegetation, and
minimal cloud cover, studying the Samail Ophiolite and the surrounding
area by remote sensing means is facilitated. Three remote data sets,
1) LANDSAT (5) TM [scenes 159-44 and 158-43], 2) CORONA satellite photography
[scenes DS09059A008MC028 and DS09034A023MC055], and 3) a G-topo digital
elevation model (DEM), were originally proposed to be the primary, secondary,
and tertiary data sets, respectfully, however, only the LANDSAT and DEM
data sets proved to be useful. Geologic mapping was based primarily
on the interpretation of the two LANDSAT scenes, whereas the DEM provided
a spatial context, and facilitated visualization of the ground terrain.
The DEM provided no major geologic contributions, but it did make for some
very nice images.
The
Sultanate of Oman is host to the Earth's largest mass of exposed ancient
oceanic crust, the Samail Ophiolite. Rock types within the ophiolite
include peridiotites, gabbros, basalts, and serpentanites. The surrounding
geology is a complex collection of intensely deformed quartzites, mafic
schists (including eclogite assemblages), calc-schists, dolomites and other
carbonates. Because of Oman's dry climate, lack of vegetation, and
minimal cloud cover, studying the Samail Ophiolite and the surrounding
area by remote sensing means is facilitated. Three remote data sets,
1) LANDSAT (5) TM [scenes 159-44 and 158-43], 2) CORONA satellite photography
[scenes DS09059A008MC028 and DS09034A023MC055], and 3) a G-topo digital
elevation model (DEM), were originally proposed to be the primary, secondary,
and tertiary data sets, respectfully, however, only the LANDSAT and DEM
data sets proved to be useful. Geologic mapping was based primarily
on the interpretation of the two LANDSAT scenes, whereas the DEM provided
a spatial context, and facilitated visualization of the ground terrain.
The DEM provided no major geologic contributions, but it did make for some
very nice images.
As proposed, the results of this work were compared with
the field mapping completed by Gregory, R.T., Gray, D.R., and Miller, J.M.,
near Masqat, Oman. The mapping completed within this project has
no where near the lithologic or structural detail achieved by the ground
team, however, geologic units discerned from the remote data do correlate
well with those of Gregory, Gray, and Miller. Preliminary evaluation
has raised some interesting questions and further investigation of the
remote data may provide reconnaissance maps for future field studies northwest
of Masqat.
As a secondary data source I used a G-topo digital elevation model made available through the UTD Laboratory. The DEM's spatial resolution footprint is approximately 800 meters which is much coarser than the LANDSAT's 30 meter resolution. By generating a topo-map with 200 ft contours, it can be easily seen that the ophiolite and associated carbonate units are high standing and make up the bulk of the Oman montains that arch from the southeast to the northwest parrallelling the coastline. The topography data also shows the two structural windows though which the basement rocks are exposed. Although the limited resolution of the DEM does not allow for direct evaluation of topographic/lithologic relationships it can be used to enhance the LANDSAT 5 images by providing a three-dimentional spatial context. Draping the Sultan's combination images over the DEM does show a broad corelation of lithology to topography (Figure 4). The DEM was also used to create a 360 degree fly around above the southeastern (158-44) true color LANDSAT image (Figure 5).
Of the two mosaic CORONA scenes purchased from the USGS, only one was scanned and evaluated. The smallness of the hard copy image (5 x 5 inches) proved to be too small to provide adequate resolution, even when scanned at the highest resolution possible. Perhaps individual CORONA swaths, rather than mosaics would provide better resolution images. Although the image was not used during this petrologic analysis, I am making the image available here at greatly reduced resolution (DS09034A023MC055) for you viewing.
Remote data/ Field Mapping Comparison
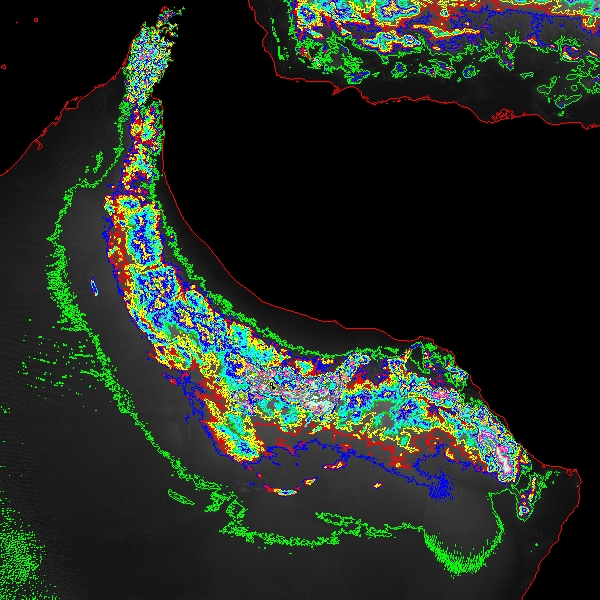
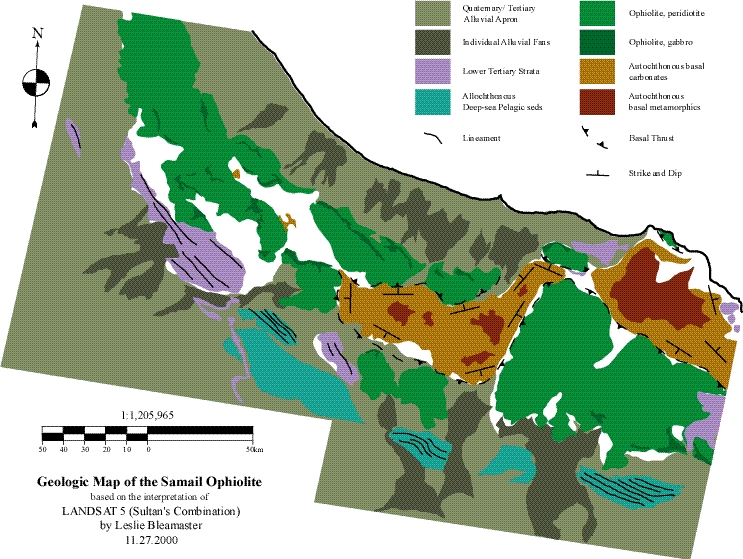
Using the map of the Saih Hatat by Gregory, Gray, and Miller as a guide to interpret the different colors produced by stretching the LANDSAT images (Figure 6), lithologic relationships were extended into other portions of the ophiolite to produce a simplified geologic map showing some of the large scale lithologic units and structural relationships. More detailed studies are to come. Please stay tuned.
Return to Les' Geological Home Page
Return to Southern Methodist University Tectonics Home Page
Return to Southern Methodist University Geology
Home Page